
Unify building and energy data and turn it into actionable insights
Get clarity
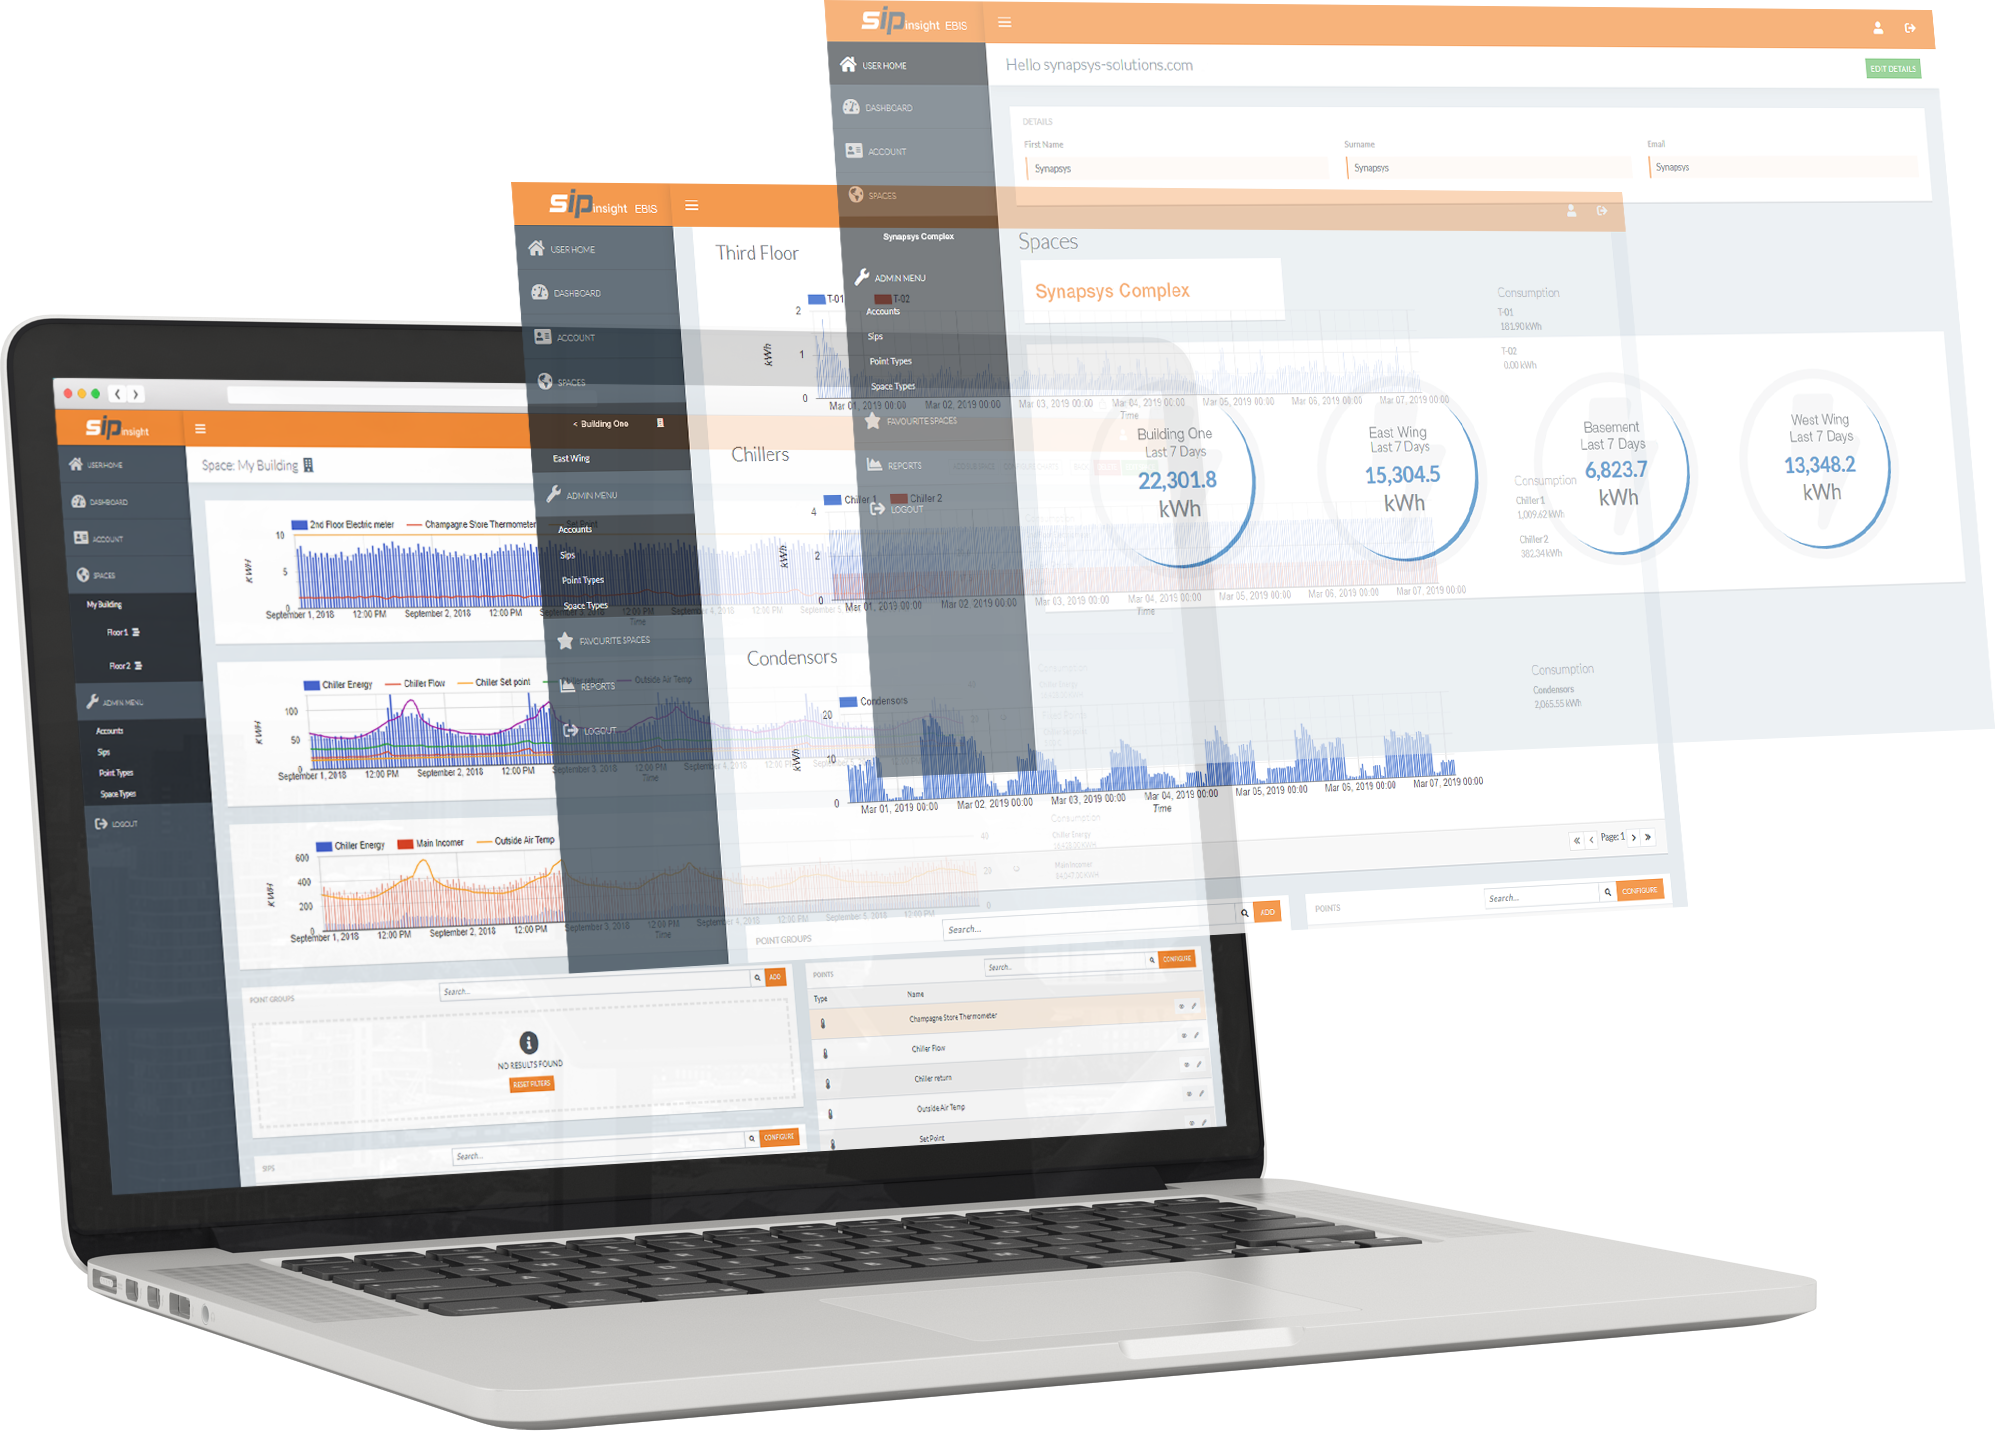
Unify data from your BMS and metering systems to get total visibility into your building and plant performance.
Get answers
See consumption trend changes as they happen, and effortlessly identify the root cause of anomalies.
Get ahead
Make faster, more impactful decisions on your sustainability and energy efficiency initiatives to get ahead of targets.
Trusted by

Key features
Cloud-based
Scale provision as your needs change.
Easy to integrate
Connect your systems independently, or get support from our team.
Fast to deploy
Get set up and start using your system quickly. Deploy independently or with support from our team.
Unifies siloed data
See consumption, plant, and meter data in a single dashboard.
Intuitive interface and reports builder
Easily customise dashboards and reports for individual users. Analyse the big picture, go granular, or anywhere in between.
Powerful analytics
Compare consumption across sites, spaces, plant, date ranges and more.
Who succeeds with Synapsys Building and Energy Monitoring Software
Get total clarity with zero manual effort
Synapsys Building and Energy Monitoring Software helps businesses across multiple industries turn building and plant data into insights that drive sustainability initiatives with more speed and precision.
Discover more
To discover how Synapsys Energy and Building and Insight Software can help you get the answers you need to meet your ESG and sustainability goals faster, get in touch.