The Challenge of Energy Management
Continuous improvement in energy management demands real information. Building managers often grapple with data from metering systems and Building Management Systems (BMS), making analysis complex and inefficient.
Visualise Your Building's Performance
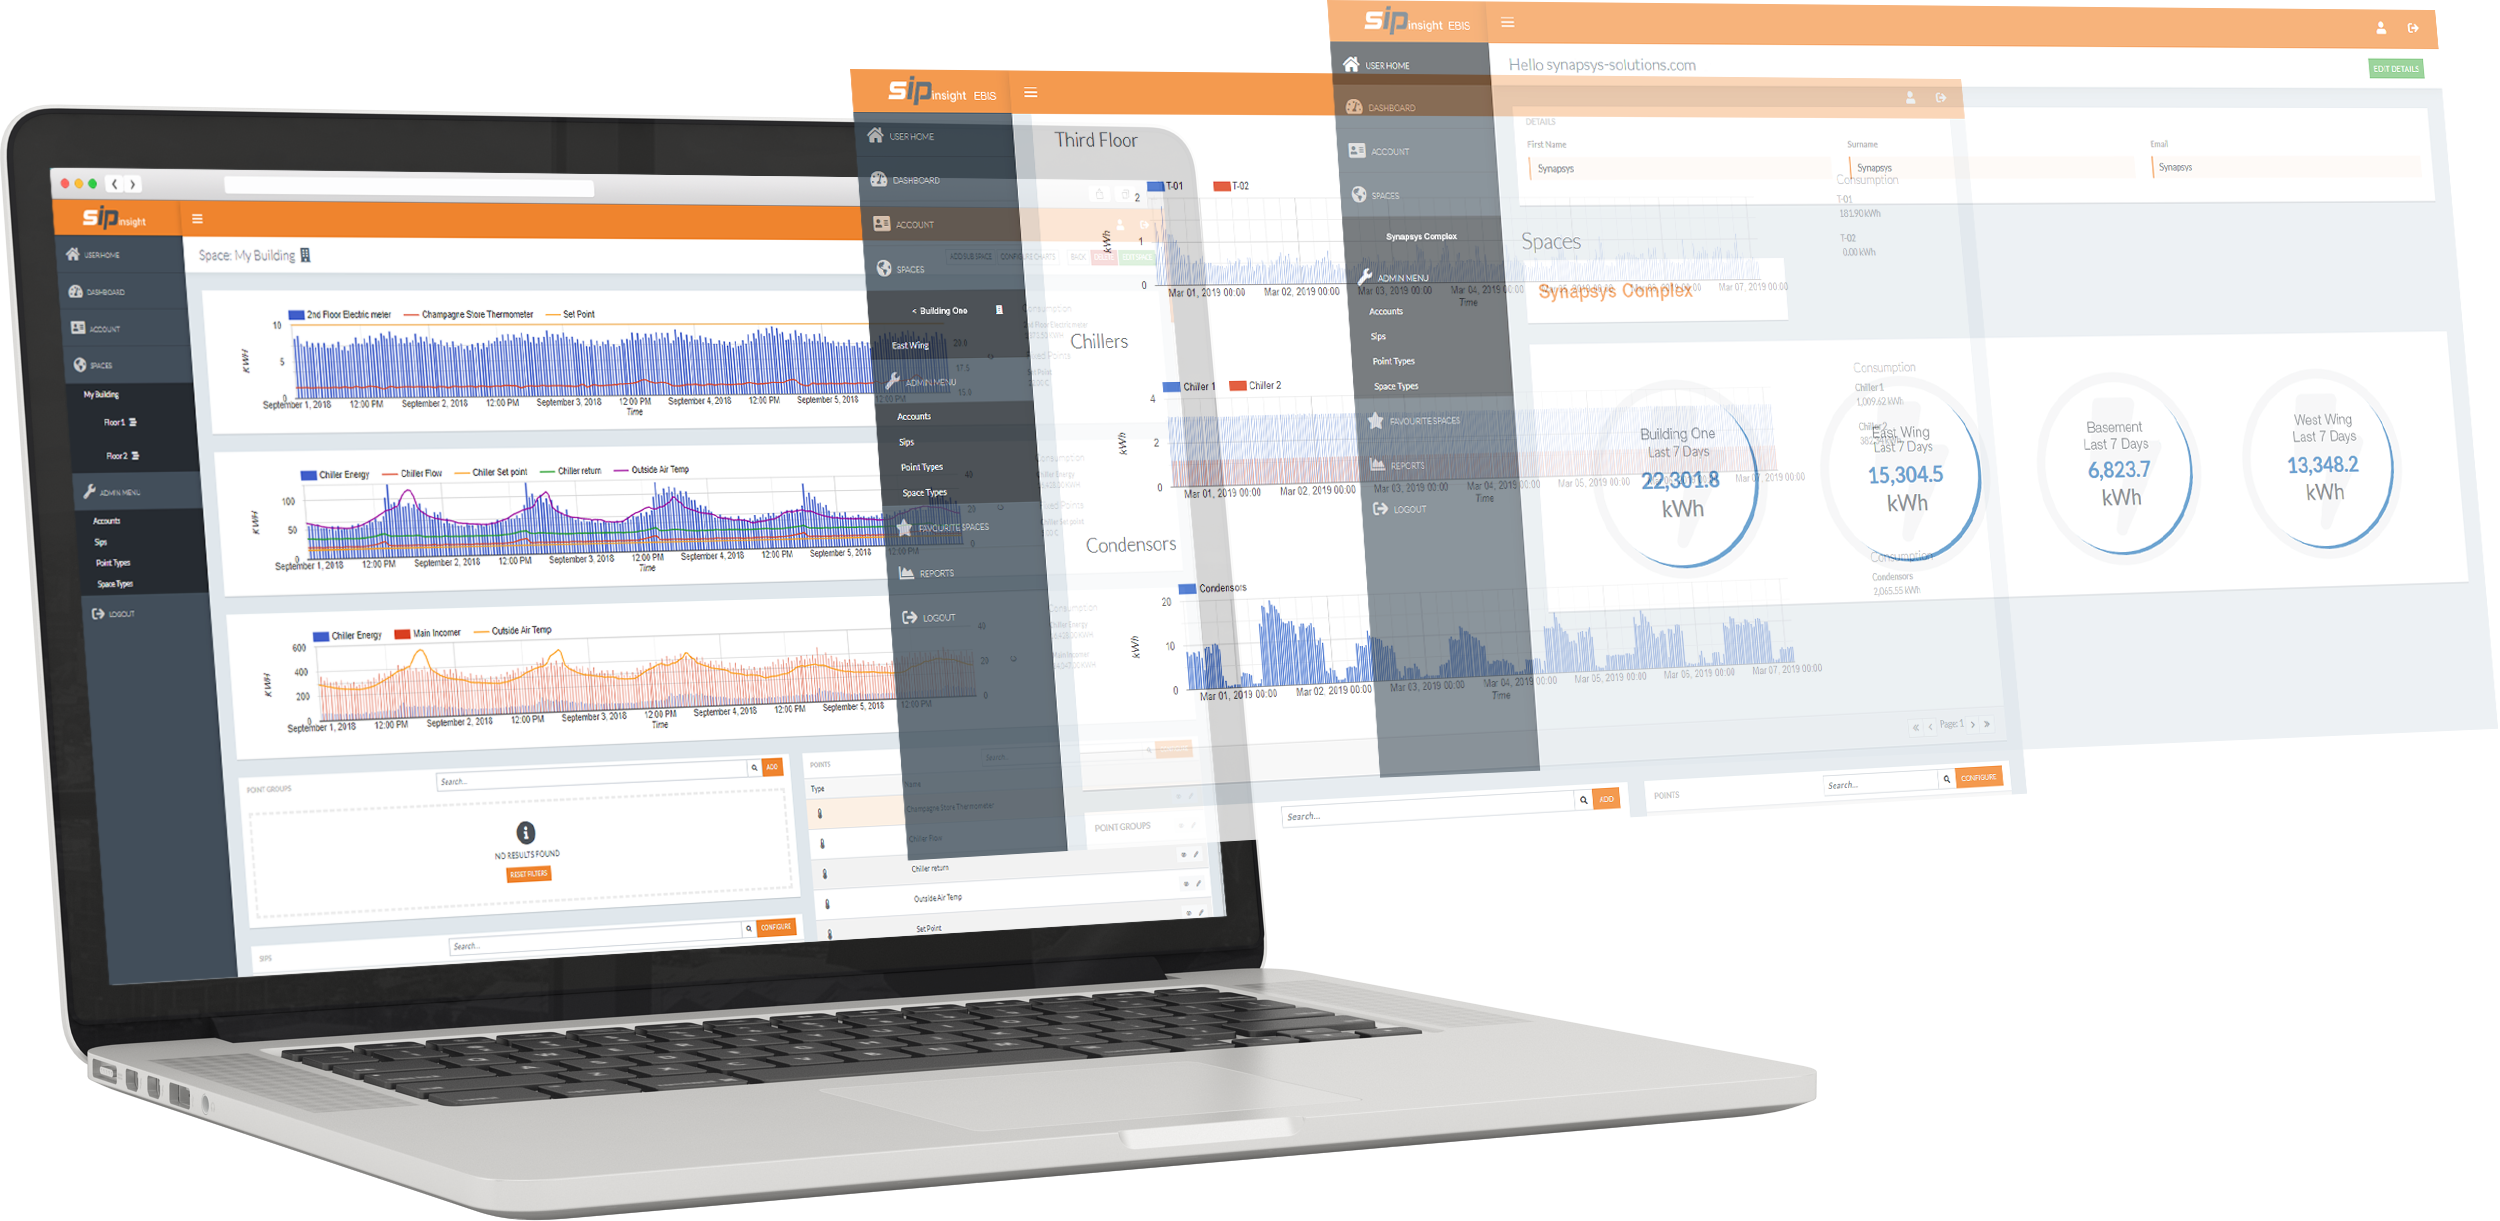
Discover our comprehensive monitoring platform that seamlessly combines Building Energy and Building Management Systems (BMS) data. Our cloud-based solution, EBIS, simplifies data correlation, analysis, and reporting, offering both single and multi-site options.
Continuous improvement in energy management demands real information. Building managers often grapple with data from metering systems and Building Management Systems (BMS), making analysis complex and inefficient.
EBIS integrates these two data sets into a unified source, empowering building and energy managers with a holistic view. Consumption trends are easily identified and acted upon through customisable charts. This strategic approach allows managers to optimise control strategies, resulting in substantial savings.
EBIS offers user-friendly tools for enhanced data understanding, including a Data Point linking tool, Dashboard builder, and Energy profiles. Reporting is simplified with tools like PDF Builder and Historical Data export, fostering improvements in building systems.
EBIS is a scalable, cloud-based solution, providing flexibility in monitoring—from a single building to an entire campus or multiple sites across the country. Users can access data remotely, and the software cost is based on the number of points required, offering freedom from location constraints.
Beyond traditional EMS systems, EBIS excels in providing more functionality. It seamlessly integrates BMS points and maps them against energy data points, allowing users to display meter values alongside related BMS values. This extra functionality enables enhanced efficiency analysis, temperature plotting on energy graphs, and the overlay of occupancy hours.
Request a personalised demonstration and learn more about how EBIS can revolutionise your approach to energy management. Contact us today for an in-depth exploration of the software's capabilities.
To discover how Synapsys Solutions can help you meet your goals faster, easier and more more cost effectively, get in touch. Fill in this form, and a member of the team will get back to you soon.